COVID-19 in the USA
Important note: This website is no longer being updated as of July 2022. While COVID-19 continues to be a concern, with vaccines widely available, growth has (in the USA at least) decreased to the point COVID-19 is no longer the overriding concern it was in 2020. Society is slowly opening up again and we are getting closer to a post-pandemic world every day.
Cases: 88,226,915 (27,688.77 per 100,000)
Deaths: 1,016,680 (319.07 per 100,000)
This is a map showing COVID-19 daily new cases (7-day average). Red means many (50 per 100,000 population or higher) new cases; green means fewer new cases.
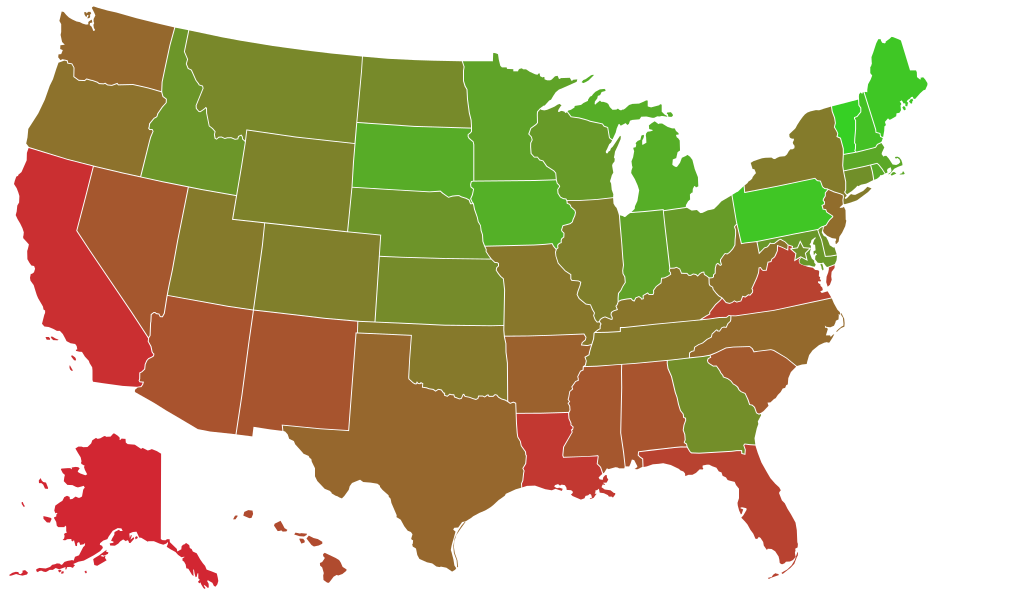
Map current as of 2022-07-07
Top 10 states
This is a list of the 10 states with the most COVID-19 growth:
Guam Growth: 0.20%
Hawaii Growth: 0.19%
California Growth: 0.19%
Alaska Growth: 0.17%
Oregon Growth: 0.17%
Puerto Rico Growth: 0.17%
Louisiana Growth: 0.16%
Washington Growth: 0.16%
Nevada Growth: 0.15%
New Mexico Growth: 0.15%
Top 20 counties
This is a list of the 20 counties with the most COVID-19 growth:
Denali Borough, Alaska Growth: 3.17%
Apache, Arizona Growth: 2.40%
Los Alamos, New Mexico Growth: 0.48%
Leon, Florida Growth: 0.46%
Marion, South Carolina Growth: 0.46%
Bristol Bay plus Lake and Peninsula, Alaska Growth: 0.43%
Dixie, Florida Growth: 0.41%
Gadsden, Florida Growth: 0.40%
Sarasota, Florida Growth: 0.39%
Polk, Florida Growth: 0.39%
Chesterfield, South Carolina Growth: 0.38%
Jefferson, Florida Growth: 0.38%
Pinellas, Florida Growth: 0.38%
Curry, Oregon Growth: 0.37%
Nassau, Florida Growth: 0.37%
Alachua, Florida Growth: 0.37%
Pasco, Florida Growth: 0.37%
Chambers, Texas Growth: 0.37%
Brevard, Florida Growth: 0.37%
States by political affiliation
This is the number of total COVID-19 cases for states where the governor has a given political affiliation.
Democrat governors
Republican governors
Site map
A site map is availableSee also
- CovidTracking.com
- NY Times interactive map showing per-county COVID-19 growth
- John Hopkins Coronavirus Resource Center
- WorldOmeter COVID-19 Coronavirus Pandemic information page
- 1Point3Acres COVID-19 Tracker
- COVID-19 Event Risk Assessment Planning Tool