This is a graph showing COVID-19 growth.
Oklahoma
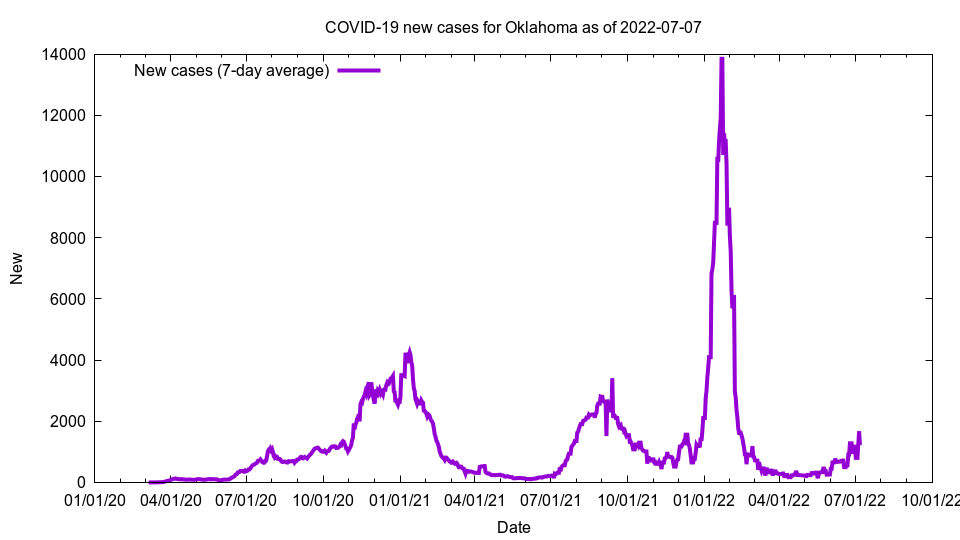
This image shows new cases for Oklahoma as of 2022-07-07
Cases: 1,084,914
Cases Per 100,000: 27,417.79
Cases 14-day per 100k: 423.20
New cases (7-day average): 1,223.43
New cases per 100k: 30.92
Growth: 0.11%
Doubling days (calculated): > 100
Doubling days (actual): 312.00
The above graph shows new cases, i.e. the number of new cases we have seen.
Cases is total COVID-19 cases; cases per 100,000 is cases per 100,000 people; cases 14-day per 100k is the total number of cases over the last 14 days, added together, then multiplied by 100,000, then divided by the population. New cases is the number of cases we have had per day on average over the last seven days. Growth is the increase in cases compared to the previous number of cases; the number is a 7-day average. Doubling days is the number of days it will take for cases to double at the current growth rate (calculated), or the number of days in the past we have had half the current number of cases (actual).
County list
Adair, Oklahoma Growth: 0.15%Alfalfa, Oklahoma Growth: 0.01%
Atoka, Oklahoma Growth: 0.08%
Beaver, Oklahoma Growth: 0.06%
Beckham, Oklahoma Growth: 0.06%
Blaine, Oklahoma Growth: 0.09%
Bryan, Oklahoma Growth: 0.12%
Caddo, Oklahoma Growth: 0.14%
Canadian, Oklahoma Growth: 0.12%
Carter, Oklahoma Growth: 0.14%
Cherokee, Oklahoma Growth: 0.14%
Choctaw, Oklahoma Growth: 0.16%
Cimarron, Oklahoma Growth: 0.17%
Cleveland, Oklahoma Growth: 0.12%
Coal, Oklahoma Growth: 0.09%
Comanche, Oklahoma Growth: 0.07%
Cotton, Oklahoma Growth: 0.05%
Craig, Oklahoma Growth: 0.11%
Creek, Oklahoma Growth: 0.13%
Custer, Oklahoma Growth: 0.10%
Delaware, Oklahoma Growth: 0.12%
Dewey, Oklahoma Growth: 0.11%
Ellis, Oklahoma Growth: 0.07%
Garfield, Oklahoma Growth: 0.07%
Garvin, Oklahoma Growth: 0.14%
Grady, Oklahoma Growth: 0.10%
Grant, Oklahoma Growth: 0.07%
Greer, Oklahoma Growth: 0.08%
Harmon, Oklahoma Growth: 0.05%
Harper, Oklahoma Growth: 0.04%
Haskell, Oklahoma Growth: 0.12%
Hughes, Oklahoma Growth: 0.17%
Jackson, Oklahoma Growth: 0.12%
Jefferson, Oklahoma Growth: 0.02%
Johnston, Oklahoma Growth: 0.08%
Kay, Oklahoma Growth: 0.14%
Kingfisher, Oklahoma Growth: 0.08%
Kiowa, Oklahoma Growth: 0.11%
Latimer, Oklahoma Growth: 0.07%
Le Flore, Oklahoma Growth: 0.13%
Lincoln, Oklahoma Growth: 0.14%
Logan, Oklahoma Growth: 0.16%
Love, Oklahoma Growth: 0.10%
Major, Oklahoma Growth: 0.13%
Marshall, Oklahoma Growth: 0.17%
Mayes, Oklahoma Growth: 0.13%
McClain, Oklahoma Growth: 0.10%
McCurtain, Oklahoma Growth: 0.10%
McIntosh, Oklahoma Growth: 0.09%
Murray, Oklahoma Growth: 0.10%
Muskogee, Oklahoma Growth: 0.12%
Noble, Oklahoma Growth: 0.09%
Nowata, Oklahoma Growth: 0.08%
Okfuskee, Oklahoma Growth: 0.13%
Oklahoma, Oklahoma Growth: 0.13%
Okmulgee, Oklahoma Growth: 0.08%
Osage, Oklahoma Growth: 0.11%
Ottawa, Oklahoma Growth: 0.17%
Pawnee, Oklahoma Growth: 0.13%
Payne, Oklahoma Growth: 0.12%
Pittsburg, Oklahoma Growth: 0.14%
Pontotoc, Oklahoma Growth: 0.17%
Pottawatomie, Oklahoma Growth: 0.13%
Pushmataha, Oklahoma Growth: 0.09%
Roger Mills, Oklahoma Growth: 0.08%
Rogers, Oklahoma Growth: 0.13%
Seminole, Oklahoma Growth: 0.14%
Sequoyah, Oklahoma Growth: 0.17%
Stephens, Oklahoma Growth: 0.12%
Texas, Oklahoma Growth: 0.08%
Tillman, Oklahoma Growth: 0.10%
Tulsa, Oklahoma Growth: 0.12%
Unknown, Oklahoma Growth: 10.01%
Wagoner, Oklahoma Growth: 0.13%
Washington, Oklahoma Growth: 0.11%
Washita, Oklahoma Growth: 0.06%
Woods, Oklahoma Growth: 0.07%
Woodward, Oklahoma Growth: 0.08%
Return to USA -
Return to top -
Deaths for this state
The data comes from The New York Times and the code to generate these pages is open source and available on GitHub. The number of actual COVID-19 cases and deaths are almost certainly higher than these figures.