This is a graph showing COVID-19 deaths.
USA
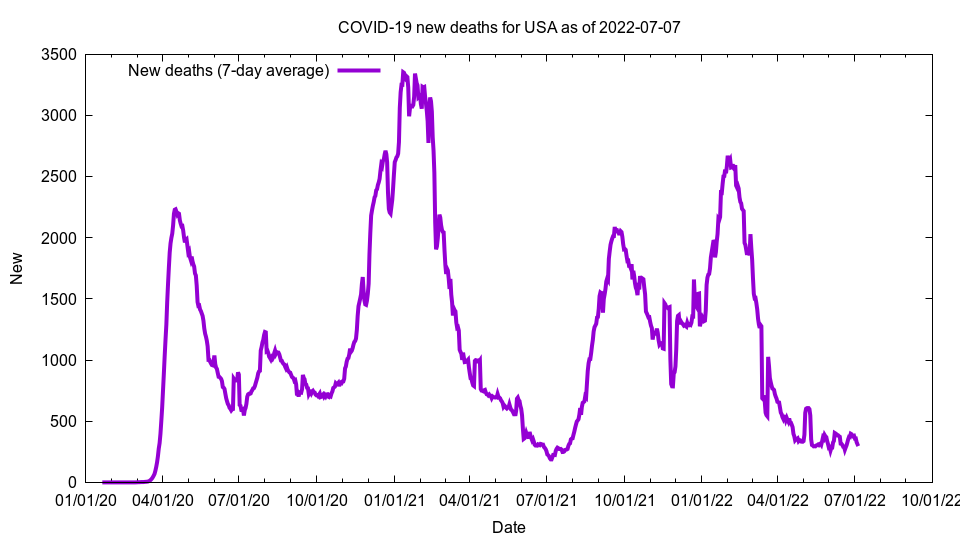
This image shows new deaths for USA as of 2022-07-07
Deaths: 1,016,680
Deaths Per 100,000: 319.07
Deaths 14-day per 100k: 1.52
New deaths (7-day average): 318.29
New deaths per 100k: 0.10
Growth: 0.03%
Doubling days (calculated): > 100
Doubling days (actual): 497.00
The above graph shows new cases, i.e. the number of new deaths we have seen.
Deaths is total COVID-19 deaths; deaths per 100,000 is deaths per 100,000 people; deaths 14-day per 100k is the total number of deaths over the last 14 days, added together, then multiplied by 100,000, then divided by the population. New deaths is the number of deaths we have had per day on average over the last seven days. Growth is the increase in deaths compared to the previous number of deaths; the number is a 7-day average. Doubling days is the number of days it will take for deaths to double at the current growth rate (calculated), or the number of days in the past we have had half the current number of deaths (actual).
It is possible to get per-state growth information. Click on a state below to get growth information about that state.
State list (deaths)
Alabama Growth: 0.02%Alaska Growth: 0.00%
American Samoa Growth: 0.00%
Arizona Growth: 0.03%
Arkansas Growth: 0.02%
California Growth: 0.04%
Colorado Growth: 0.04%
Connecticut Growth: 0.01%
Delaware Growth: 0.00%
District of Columbia Growth: 0.02%
Florida Growth: 0.06%
Georgia Growth: 0.04%
Guam Growth: -0.04%
Hawaii Growth: 0.19%
Idaho Growth: 0.04%
Illinois Growth: 0.02%
Indiana Growth: 0.01%
Iowa Growth: 0.02%
Kansas Growth: -0.00%
Kentucky Growth: 0.03%
Louisiana Growth: 0.01%
Maine Growth: 0.22%
Maryland Growth: 0.04%
Massachusetts Growth: 0.05%
Michigan Growth: 0.02%
Minnesota Growth: 0.04%
Mississippi Growth: 0.02%
Missouri Growth: 0.04%
Montana Growth: 0.00%
Nebraska Growth: 0.03%
Nevada Growth: 0.05%
New Hampshire Growth: 0.07%
New Jersey Growth: 0.02%
New Mexico Growth: 0.03%
New York Growth: 0.02%
North Carolina Growth: 0.03%
North Dakota Growth: 0.00%
Northern Mariana Islands Growth: 0.00%
Ohio Growth: 0.03%
Oklahoma Growth: 0.00%
Oregon Growth: 0.05%
Pennsylvania Growth: 0.02%
Puerto Rico Growth: 0.11%
Rhode Island Growth: 0.02%
South Carolina Growth: 0.01%
South Dakota Growth: 0.01%
Tennessee Growth: 0.04%
Texas Growth: 0.02%
Utah Growth: 0.04%
Vermont Growth: 0.08%
Virgin Islands Growth: 0.00%
Virginia Growth: 0.08%
Washington Growth: 0.07%
West Virginia Growth: 0.01%
Wisconsin Growth: 0.04%
Wyoming Growth: 0.00%
The data comes from The New York Times and the code to generate these pages is open source and available on GitHub. The number of actual COVID-19 cases and deaths are almost certainly higher than these figures.